Plot One Shift-Magnitude Comparison
Source:R/shift-distributions.R
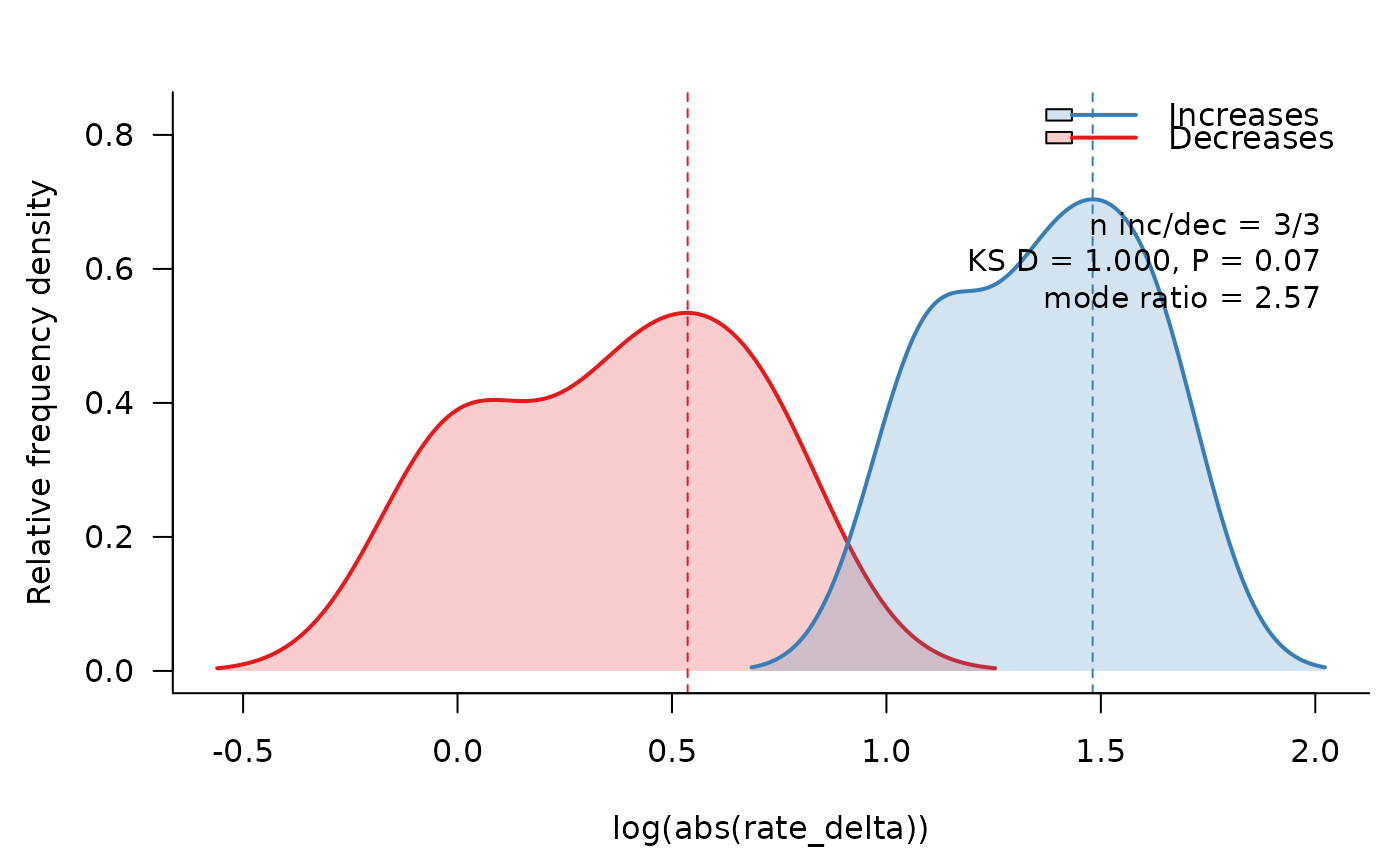
plot.shift_magnitude_comparison.RdDraw one density panel from a compare_shift_magnitudes() result. By
default, the method reproduces the Berv et al. (2026) Supplementary Figure 5
scaling: each density integrates to that direction's observed frequency, so
panel height reflects both shift magnitude and relative abundance. Set
scale_by_frequency = FALSE for conventional unit-area densities.
Usage
# S3 method for class 'shift_magnitude_comparison'
plot(
  x,
  scale_by_frequency = TRUE,
  density_args = list(),
  colors = c(increase = "#377eb8", decrease = "#e41a1c"),
  fill_alpha = 0.22,
  lwd = 2,
  xlim = NULL,
  ylim = NULL,
  xlab = NULL,
  ylab = NULL,
  main = NULL,
  annotate = TRUE,
  show_modes = TRUE,
  show_sample_size = TRUE,
  show_test_label = TRUE,
  show_modal_ratio = TRUE,
  legend = TRUE,
  rug = FALSE,
  mar = c(4.5, 4.5, 2.4, 0.8),
  oma = c(0, 0, 0, 0),
  ...
)
Arguments
- x
A single
shift_magnitude_comparisonobject.- scale_by_frequency
Logical; multiply each density by its observed increase/decrease frequency.
- density_args
Optional named list of additional arguments passed to
stats::density().- colors
Named colors for
"increase"and"decrease".- fill_alpha
Alpha value for density fills.
- lwd
Line width for density curves.
- xlim, ylim
Optional axis limits.
- xlab, ylab, main
Plot labels.
- annotate
Logical; draw panel annotations. This is a master switch for
show_sample_size,show_test_label, andshow_modal_ratio.- show_modes
Logical; draw dashed vertical lines at the KDE modes for increase and decrease magnitudes.
- show_sample_size
Logical; include increase/decrease sample sizes in panel annotations when
annotate = TRUE.- show_test_label
Logical; include KS statistics and p-values in panel annotations when
annotate = TRUEand a KS test is available.- show_modal_ratio
Logical; include the back-transformed modal ratio in panel annotations when
annotate = TRUEand it is finite.- legend
Logical; draw an increase/decrease legend.
- rug
Logical; add rugs for the transformed values.
- mar, oma
Graphical margins passed to
graphics::par().- ...
Additional graphical parameters passed to
graphics::plot().
Value
Invisibly returns a list with the comparison object, summary tables, density estimates, and plot settings.
Examples
transitions <- data.frame(
  rate_change = c("increase", "increase", "increase", "decrease", "decrease", "decrease"),
  rate_delta = c(3, 4, 5, -1, -1.5, -2)
)
comparison <- compare_shift_magnitudes(transitions, ks_reps = 99)
plot(comparison)