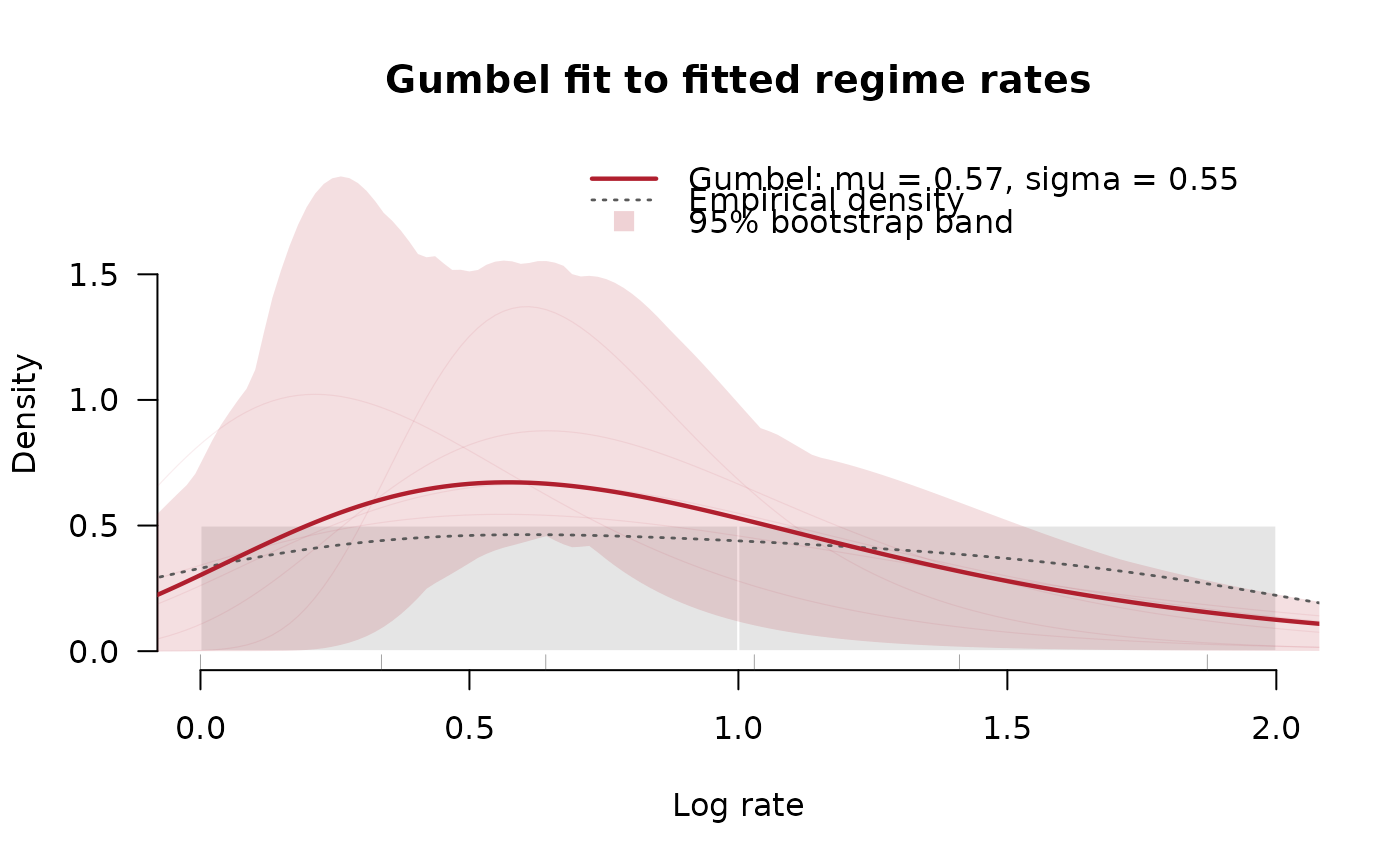
Plot a fitted candidate distribution from fit_rate_distribution(). The
current method supports the Gumbel candidate used by Berv et al. (2026). It
can overlay a pointwise bootstrap band and bootstrap density curves when
bootstrap_rate_distribution() has already stored bootstrap draws on x.
Arguments
- x
A
rate_distribution_fitobject.- model
Distribution model to plot. Currently only
"gumbel"is supported.- bootstrap
NULLor logical. IfNULL, draw the bootstrap overlay when precomputed draws formodelare available. IfTRUE, require precomputed draws frombootstrap_rate_distribution(). IfFALSE, draw no bootstrap overlay.- bootstrap_curves
Number of precomputed bootstrap density curves to draw over the band. Set to
0to draw only the band.- col
Color for the fitted density, bootstrap band, and bootstrap curves.
- hist_col
Histogram fill color. A vector of colors is passed through to
graphics::hist()and can color bins individually.- band_alpha, curve_alpha
Alpha values for the bootstrap band and individual bootstrap curves.
- data_density
Logical; overlay the empirical kernel density.
- rug
Logical; add a rug for the fitted data values.
- breaks
Histogram breaks passed to
graphics::hist().- main, xlab, ylab
Plot labels.
- ...
Additional arguments passed to
graphics::hist().
Value
Invisibly returns a list with the x grid, fitted density, bootstrap densities, bootstrap band, and plotted parameter table.
Examples
if (requireNamespace("univariateML", quietly = TRUE) &&
    requireNamespace("evd", quietly = TRUE)) {
  fit <- fit_rate_distribution(c(1, 1.4, 1.9, 2.8, 4.1, 6.5), models = "gumbel")
  fit <- bootstrap_rate_distribution(fit, model = "gumbel", reps = 25, seed = 1)
  plot(fit, bootstrap_curves = 5)
}