
Render a computed "rateMap" object. The usual workflow is
x <- rateMap(...) followed by plot(x, ...).
Usage
# S3 method for class 'rateMap'
plot(
  x,
  value = "value",
  palette = NULL,
  reverse_palette = NULL,
  color_mode = NULL,
  n_categories = NULL,
  category_bin_method = NULL,
  category_breaks = NULL,
  category_labels = NULL,
  ncolors = NULL,
  legend_title = NULL,
  legend = NULL,
  fsize = NULL,
  tip_fsize = NULL,
  legend_fsize = NULL,
  ftype = NULL,
  show_tip_labels = TRUE,
  outline = FALSE,
  lwd = 3,
  type = c("phylogram", "fan", "arc"),
  mar = rep(0.3, 4),
  direction = "rightwards",
  offset = NULL,
  xlim = NULL,
  ylim = NULL,
  hold = TRUE,
  underscore = FALSE,
  arc_height = 2,
  legend_digits = NULL,
  ...
)
Arguments
- x
An object of class
"rateMap"returned byrateMap()orrateMapView().- value
Character column in the plotted summary table (
x$intervals) to map to branch colors. The default"value"plots the central estimate chosen byrateMap(). Whenuncertainty = TRUE, useful alternatives include"mean","median","sd","ci_width","highest_density_interval_width", and"cv".- palette
Optional palette override used for this plot. This can be an
hcl.colors()palette name, a vector of colors, or a palette function.- reverse_palette
Optional logical override for palette reversal used for this plot.
- color_mode
Optional color-mode override. Use
"continuous"for a numeric color ramp or"category"for ordered discrete rate categories. IfNULL, the stored mode inxis used. Category mode draws one color per exact value or category bin; continuous mode draws a many-color ramp.- n_categories
Optional category-count override for
color_mode = "category". This changes the target number of category bins, not the number of colors in continuous mode.- category_bin_method
Optional category-binning override for
color_mode = "category". Use"pretty"for pretty breaks or"equal"for equal-width numeric intervals. Ignored whencategory_breaksis supplied.- category_breaks
Optional category-break override for
color_mode = "category". Custom breaks override automatic bins. Category legends draw valid numeric interval breaks with proportional segment widths.- category_labels
Optional category-label override for
color_mode = "category".- ncolors
Optional number of colors to use when recoloring this plot with
color_mode = "continuous". If omitted, the storedx$ncolorsvalue is used, falling back to256for older objects.- legend_title
Optional legend title override for this plot.
- legend
Legend length. If
NULLorTRUE, a layout-specific default is used. Setlegend = FALSEto suppress the legend. Continuous legends are drawn withphytools::add.color.bar(); category legends are drawn byrateMapso bin labels can reflect rate categories and diagnostics.- fsize
Numeric font-size vector. The first element is passed as the tip label
fsizetophytools::plotSimmap()and, whenoutline = TRUE, tophytools::plotTree(). The second element is used by the legend.- tip_fsize
Optional override for the first
fsizeelement passed to the underlying tree plot.- legend_fsize
Optional override for the legend font size.
- ftype
Font type. The first element is passed as
ftypetophytools::plotSimmap()and, whenoutline = TRUE, tophytools::plotTree(). The second element is reserved for legends.- show_tip_labels
Logical; if
FALSE,rateMapsets the tree-plotftypeto"off"before calling the underlyingphytoolsplotter.- outline
Logical; if
TRUE, draw a branch outline beneath the rate map. The outline pass is drawn withphytools::plotTree()before the coloredphytools::plotSimmap()pass.- lwd
Branch and legend line widths. The first element is passed to
phytools::plotSimmap()and, with+ 2, tophytools::plotTree()for outlines. The second element is used for the legend.- type
Plot type:
"phylogram","fan", or"arc". This is passed tophytools::plotSimmap()for fan and arc layouts and tophytools::plotTree()for outline passes.- mar
Plot margins passed to
phytools::plotSimmap()and, whenoutline = TRUE, tophytools::plotTree().- direction
Plotting direction for
type = "phylogram"; passed tophytools::plotSimmap()andphytools::plotTree().- offset
Tip-label offset passed to
phytools::plotSimmap()and, whenoutline = TRUE, tophytools::plotTree().- xlim, ylim
Optional plot limits passed to
phytools::plotSimmap()and, whenoutline = TRUE, tophytools::plotTree().- hold
Logical controlling
rateMap's device hold/flush guard.rateMappasseshold = FALSEto the internalphytoolscalls so the two-pass outline/color drawing is controlled in one place.- underscore
Logical; if
FALSE, underscores in tip labels may be shown as spaces by the underlyingphytools::plotSimmap()andphytools::plotTree()calls.- arc_height
Arc height passed through to
phytools::plotSimmap()and, for outlines,phytools::plotTree()whentype = "arc".- legend_digits
Optional number of digits for legend endpoint labels. If omitted, small-magnitude values use enough digits to avoid zero-valued legend endpoints.
- ...
Additional arguments are rejected. Include all display choices as named
plot()arguments.
Details
The plot method uses phytools::plotSimmap() and draws either a continuous
color-bar legend or a segmented rate-category color bar.
The plotting controls intentionally mirror the phytools density-map
plotting style for phylogram, fan, and arc layouts.
In branch-summary category mode, near-zero or high-outlier rate diagnostics
are drawn as special categories when rate-valued columns are plotted; these
special categories do not consume positions in the ordered palette used for
regular rate bins. When special categories are present, the category legend
spans the full plotted value range and marks the diagnostic cutoff separating
special and regular bins. When plotting non-rate columns such as "sd",
diagnostic columns are preserved only as metadata with rate_flag_source
provenance; special rate categories are not drawn for those non-rate values.
The selected value column must contain finite values for every plotted
interval; uncertainty columns such as "sd" may be all NA for single-fit
objects and are rejected with a clear error.
The plot() method handles "phylogram", "fan", and "arc" layouts.
legend controls the length of the color bar; set legend = FALSE to
suppress it. legend_digits controls numeric endpoint labels and defaults
to enough precision to avoid rounding small values to zero. Single fitted
objects should be converted explicitly with rateMap() before plotting, for
example plot(rateMap(search_a), ...).
For fan and arc layouts, phytools resolves the getYmult() geometry helper
from plotrix. bifrost imports that helper so installed-package plotting
has the required dependency available without creating or modifying a
getYmult binding in the user's global environment.
Relationship to phytools plotting arguments. plot.rateMap() keeps the
tree-layout argument names close to phytools: type, fsize, ftype,
lwd, mar, direction, offset, xlim, ylim, underscore, and
arc_height are forwarded to phytools::plotSimmap() or
phytools::plotTree() as described above. rateMap fixes
phytools::plotSimmap() options such as colors, pts, node.numbers,
add, and hold internally, because those are determined by the computed
"rateMap" object and by the optional outline pass. palette,
color_mode, n_categories, category_breaks, category_labels,
legend_title, legend_digits, and the rate-flag display behavior are
rateMap controls, not phytools arguments.
References
Revell, L. J. (2013). Two new graphical methods for mapping trait evolution on phylogenies. Methods in Ecology and Evolution, 4, 754-759.
Revell, L. J. (2024). phytools 2.0: an updated R ecosystem for phylogenetic comparative methods (and other things). PeerJ, 12, e16505. doi:10.7717/peerj.16505
Examples
toy_tree <- ape::read.tree(text = "((a:1,b:1):1,c:2);")
toy_tree <- phytools::paintSubTree(
toy_tree,
node = ape::Ntip(toy_tree) + 1L,
state = "0"
)
toy_tree <- phytools::paintSubTree(
toy_tree,
node = ape::Ntip(toy_tree) + 2L,
state = "1"
)
toy_fit <- list(
variables = list(tree = toy_tree),
param = c("0" = 0.1, "1" = 0.5)
)
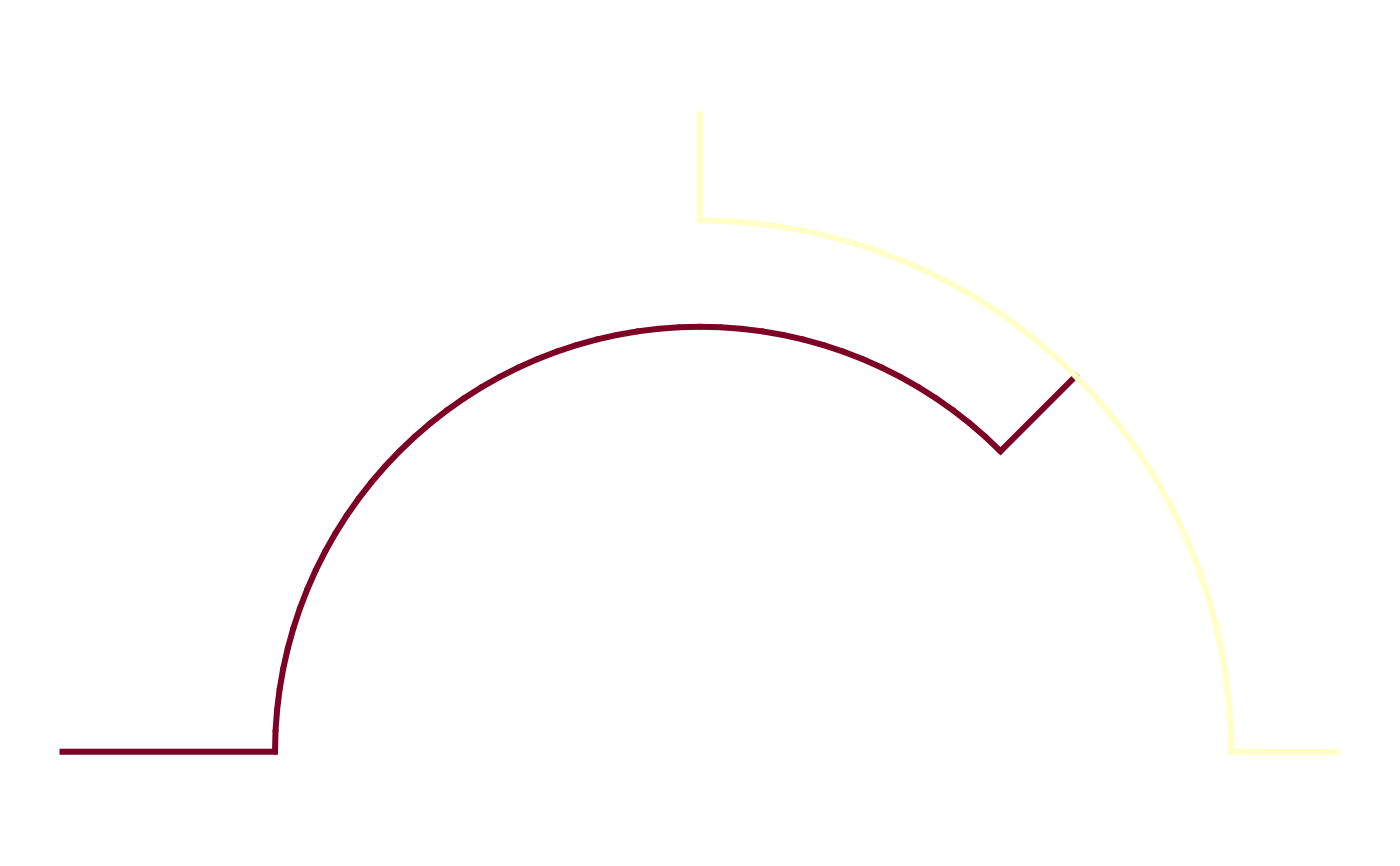
rm_obj <- rateMap(toy_fit, log = FALSE, progress = FALSE)
plot(
rm_obj,
type = "arc",
show_tip_labels = FALSE,
legend = FALSE
)
 #> rateMap object
#> - fits: 1
#> - summary: branch
#> - target: first
#> - check: full
#> - weights: equal
#> - uncertainty: FALSE
#> - color mode: category
#> - plotted value: value
#> - value range: 0.1 to 0.5
#> - rate flags: 0 near-zero, 0 high-outlier (method: none)
#> - fold range: 5 full, 5 regular
#> rateMap object
#> - fits: 1
#> - summary: branch
#> - target: first
#> - check: full
#> - weights: equal
#> - uncertainty: FALSE
#> - color mode: category
#> - plotted value: value
#> - value range: 0.1 to 0.5
#> - rate flags: 0 near-zero, 0 high-outlier (method: none)
#> - fold range: 5 full, 5 regular