Generate Scaled Viridis Color Palette for Rate Parameters
Source:R/plotting-utils.R
generateViridisColorScale.RdCreates a named color mapping for a set of numeric parameters (e.g., evolutionary rates) using the viridis color palette. Parameters are first sorted in ascending order and normalized to the range [0, 1], then mapped to evenly spaced viridis colors for intuitive visualization.
Value
A named list with two elements:
NamedColorsA named character vector of hex color codes, with names corresponding to the input parameter names, ordered by increasing parameter value.
ParamColorMappingA named numeric vector of the sorted parameter values, maintaining the same order and names as
NamedColors.
Details
This function is useful for plotting results where parameters should be visually distinguished based on their magnitude (e.g., rate shifts across a phylogeny). By using the perceptually uniform viridis palette, it avoids misleading color interpretations common with rainbow scales.
See also
viridis::viridis() for details on
the color palette.
Examples
if (requireNamespace("viridis", quietly = TRUE)) {
library(viridis)
set.seed(1)
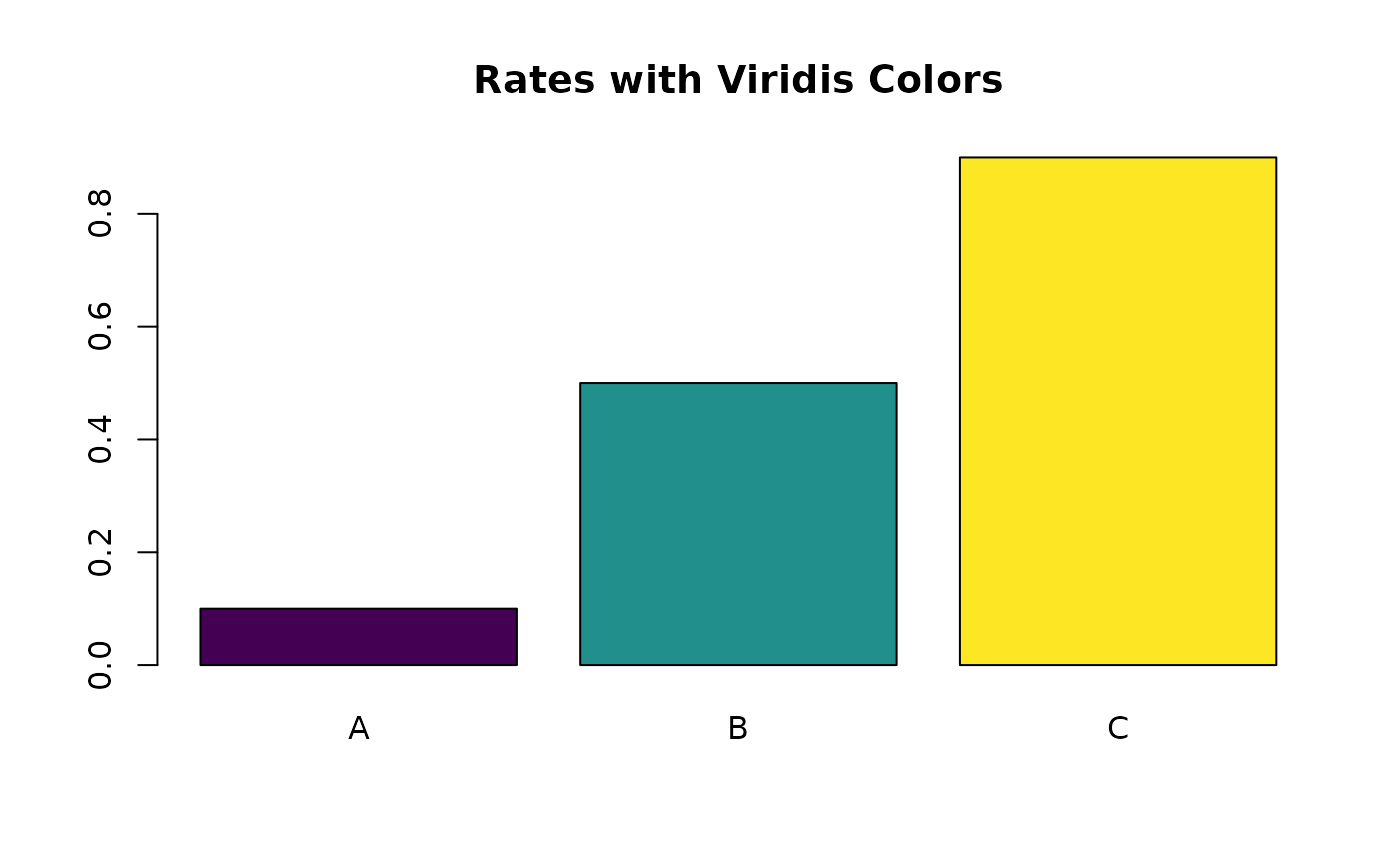
rates <- c(A = 0.1, B = 0.5, C = 0.9)
color_scale <- generateViridisColorScale(rates)
# View the color assignments
color_scale$NamedColors
# Plot with colors
barplot(color_scale$ParamColorMapping,
col = color_scale$NamedColors,
main = "Rates with Viridis Colors")
}
#> Loading required package: viridisLite